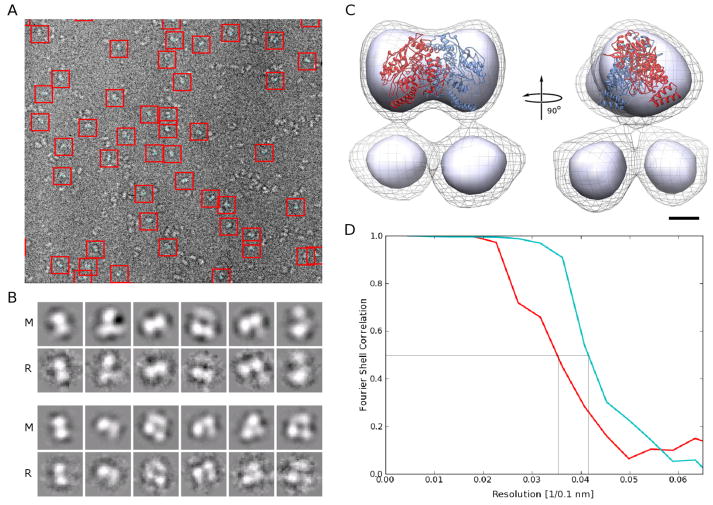
Figure 1. Cryo-EM data quality indicators and initial reconstruction.
A. Typical electron cryo micrograph with boxed eNOS particles in the presence of CaM. Micrographs of eNOS in the absence of CaM look similar.
B. Projections of the final model (column ‘M’) for the most prominent conformation of eNOS in the absence (lower panel) and presence of CaM (upper panel) and refernece-free class averages from the unsorted data (columns ‘R’) show excellent agreement. The dimensions of the boxes in A and B are 110 Å by 110 Å.
C. Two orthogonal views of the initial reconstruction of the eNOS holoenzyme in the presence of CaM obtained without sorting the data. Two contour levels are shown. The contour level represented by the solid surface is chosen so that the ‘head’ contains the volume expected for the oxygenase dimer. At this contour level, the two ‘legs’ are not connected to the ‘head’ of the reconstruction and are also separate from each other, indicating high mobility of the underlying structural elements. The contour level represented by the wire mesh shows that, at lower density levels, the legs indeed connect to the head and are not separate entities. The eNOS oxygenase dimer crystal structure is overlaid onto the density of the ‘head’ for reference. The bar represents 25 Å.
D. Fourier shell correlation from two halves of frequency limited sorted data for eNOS in the absence (red) and presence (cyan) of CaM. The curves drop below 0.5 (indicated by grey lines) at 28 Å (without CaM) and 25 Å (with CaM), respectively.

