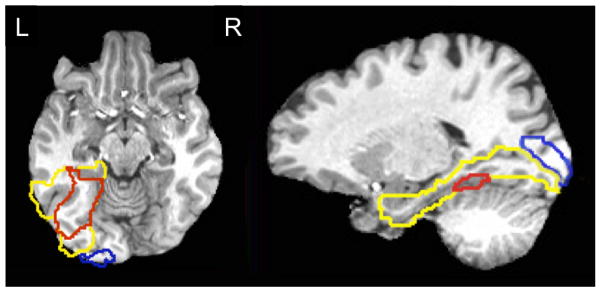
Figure 2.

ROI Outlines. Extent of EVC (BA 17) shown in blue, VT in yellow, and mid FG in red in representative subject. Note mid FG is a subregion of VT and thus the borders of these ROIs overlap. Axial slice shown at z = −10, sagittal slice shown at x = −18.
