
Figure 3.
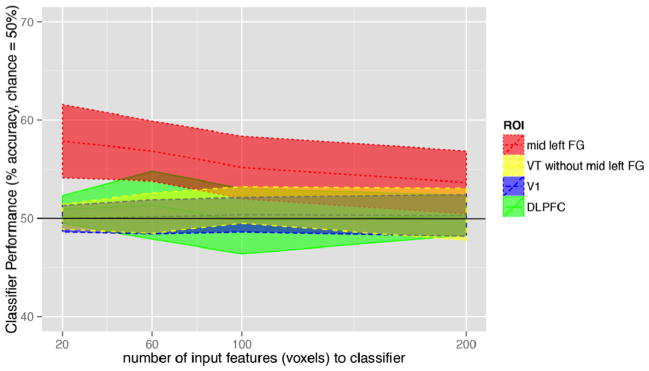
Classification across subje ects (n=10) over all folds (n=4) using best 20, 60, 100, and 200- voxels per fold. Lines indicate median classification performance, and ribbons indicate confidence intervals of classification performance across the ten subjects.