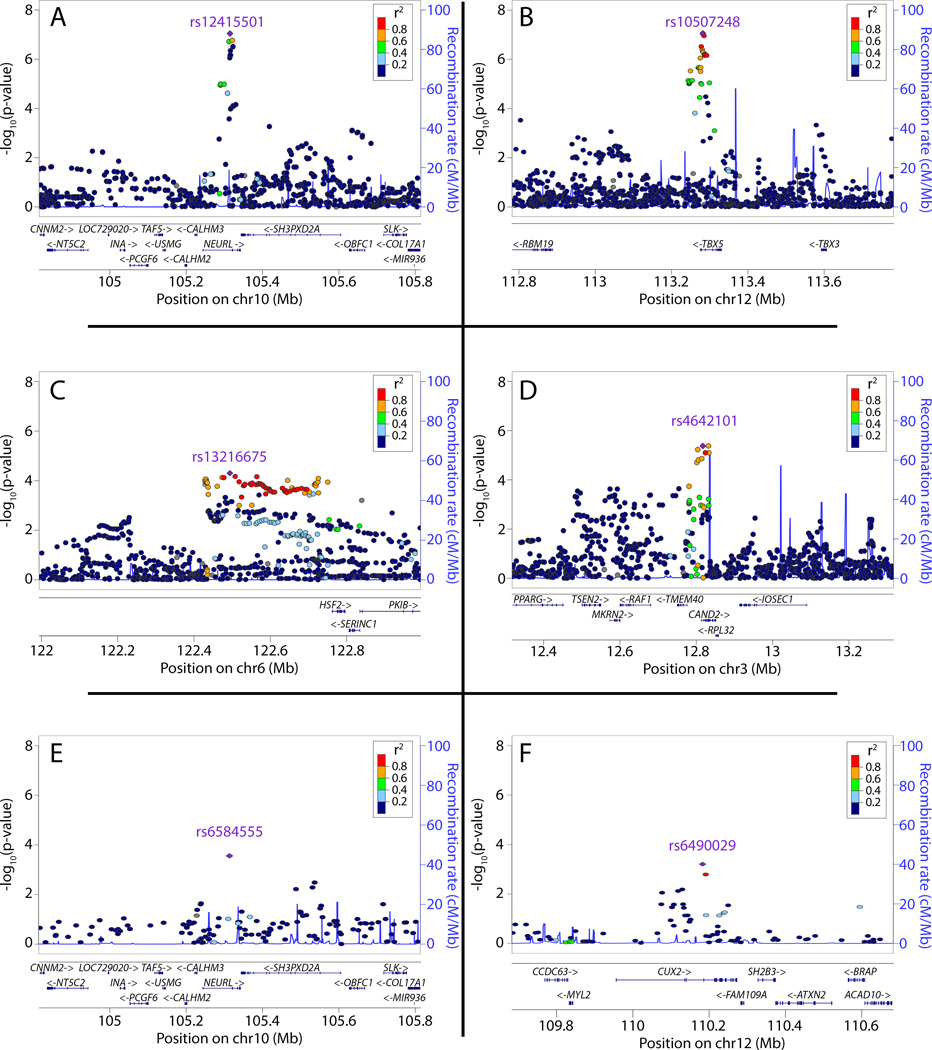
Figure 2.
Regional plots for novel atrial fibrillation susceptibility loci in Europeans and Japanese. Panels A-D (A: NEURL B: TBX5 C: GJA1 D: CAND2) show 4 novel loci detected in Europeans, panels E (NEURL) and F (CUX2) show 2 novel loci detected in Japanese. At each novel locus (p≤5×10⁻⁸), SNPs are plotted using the genomic position (NCBI Build 36) and discovery stage P values. In each panel, the sentinel SNP is labeled in purple. Each dot represents a SNP. The strength of the linkage disequilibrium of SNPs with the sentinel-SNP is indicated by a color gradient according to the legend in each panel, where red indicates strong, and blue indicates weak linkage disequilibrium. Estimated recombination rates are shown by the blue line, and spikes indicate locations of frequent recombination. Below each panel, the chromosomal positions of the SNPs and regional candidate genes are annotated. Linkage disequilibrium and recombination rates in panels A-F are based on the CEU HapMap release 22 (European) and JPT + CHB HapMap release 22 (Japanese), respectively. All regional association plots prepared using LocusZoom.

