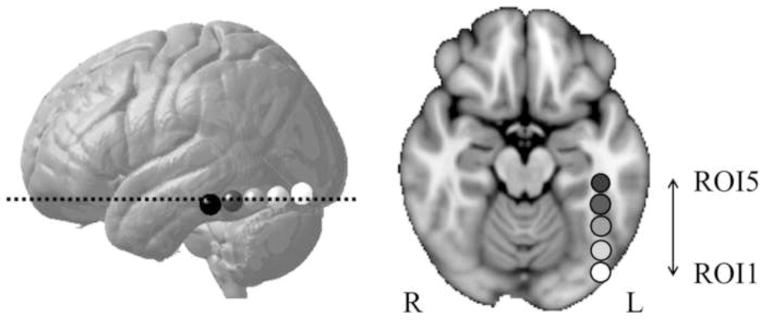
Figure 1.

Illustation of the five L-OT/F ROIs. A lateral view of the five L-OT/F ROIs is shown in (a), where the ROIs progress along a posterior to anterior gradient, each with a radius of 6 mm. The brightest ROI was numbered 1st, and the 3rd ROI represents center of the putative VWFA. An axial view of the five L-OT/F ROIs was shown in (b), corresponding to the slice labeled with a dotted line in (a).
