
Figure 2.
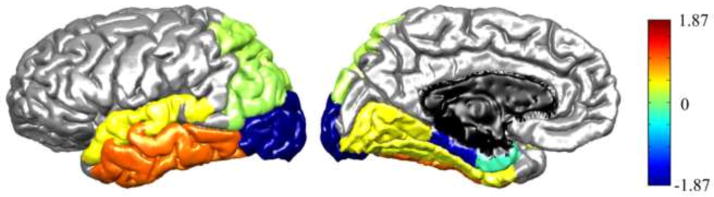
Cortical contributions to the group differences in the connectivity pattern of L-OT/F ROI2. A linear regression of group membership (1 for TD, 0 for WRD) onto connectivity profiles was performed, and regression coefficients, β, were displayed in colors to show contributions from each cortical parcel that best described the group difference, i.e., cortical parcels that had a higher connection ratio in TD than WRD were labeled with hot colors, vice versa.