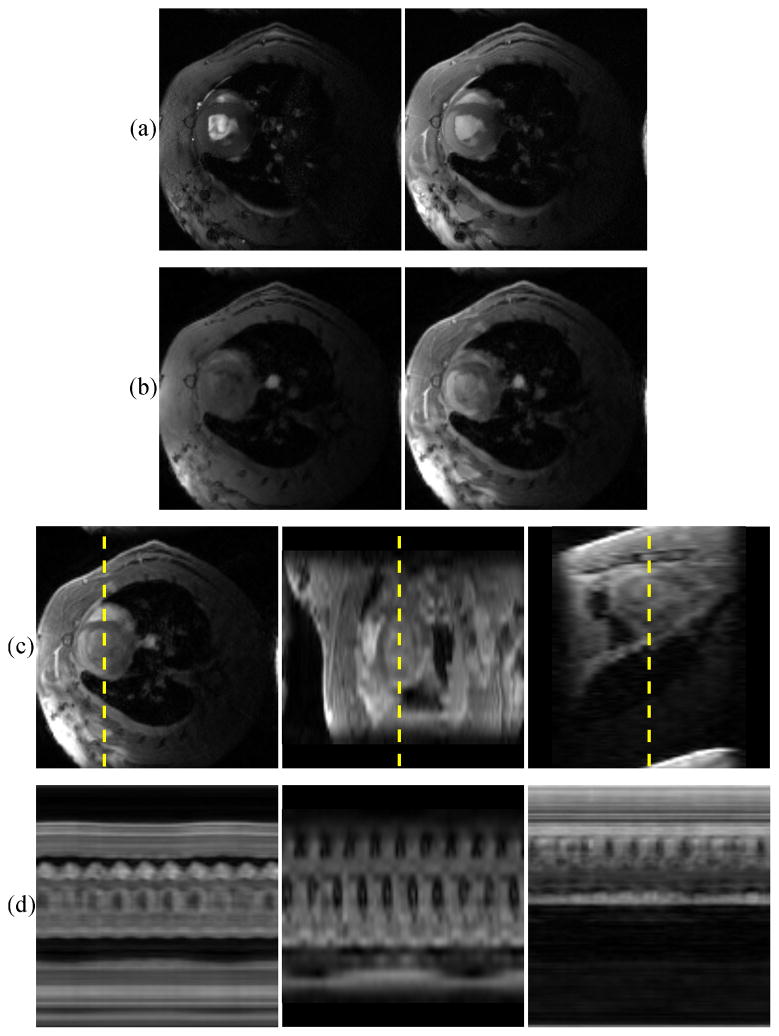
Fig. 8.
Representative IRI images on the day of surgery. (a) 2-D IntraGate images pre- and post-contrast, (b) corresponding slices from 3-D cone-navigated images pre- and post-contrast, (c) three perpendicular views of the 3-D cone-navigated images post-contrast, and (d) spatiotemporal slices through the dotted lines. The extent of the in-plane LGE perfusion defect match in (a) and (b). The images in (a) and (b) have different contrast due to the differences between slice and slab excitation. The spatial-coverage benefit of 3-D imaging can be seen in (c), which shows how far the perfusion defect extends towards the apex of the heart.

