


Fig. 9.
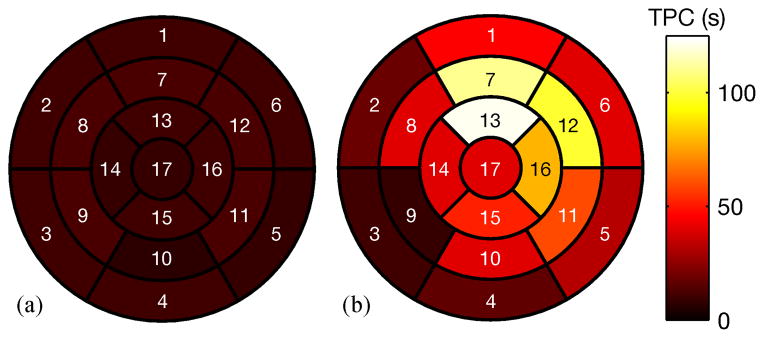
17-segment bullseye plots showing time to peak concentration (TPC) for: (a) a control rat; (b) a rat with IRI (the same rat shown in Fig. 8). The TPC measurements in (b) indicate extensive myocardial damage compared to (a), especially in the apical anterior, mid-ventricular anterior, mid-ventricular anterolateral, and apical lateral segments, consistent with the LGE images in Fig. 8