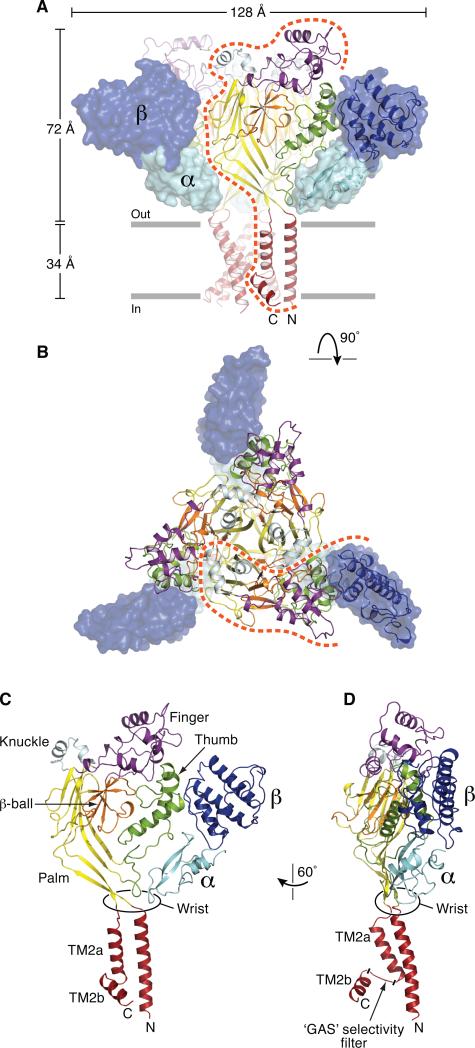
Figure 1.
Architecture of the Δ13-MitTx complex. (A) Subunits of Δ13 and MitTx are color-coded by domain. The Δ13 ion channel is in cartoon and MitTx subunits are in surface representation with one heterodimer also shown in cartoon representation. The orange dashed line defines the region of one subunit. (B) View along the 3-fold axis of symmetry, from the extracellular side of the membrane. (C, D) Cartoon representation of a single subunit derived from the Δ13-MitTx complex. See also Figure S1 and Table S1.

