Figure 3.
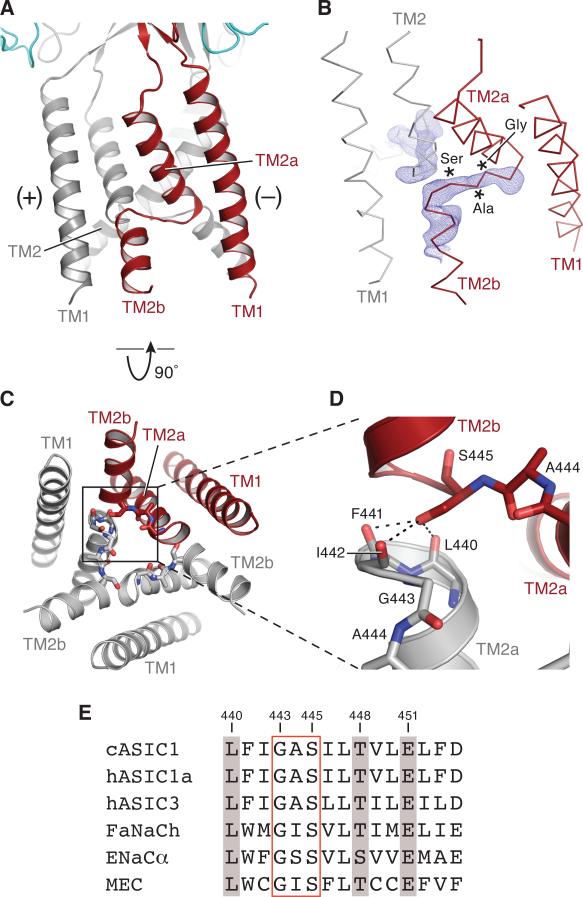
Transmembrane domain swap mediated by the ‘GAS’ belt. (A) Cartoon representation of Δ13 transmembrane domains. One subunit is red and the region above and below the ‘GAS’ belt is labeled as ‘TM2a’ and ‘TM2b,’ respectively. (B) Fo-Fc ‘omit’ map generated with a model lacking residues Ile 442 to Leu 450 contoured at 3.0 σ. The Δ13 is shown as an α-carbon trace with one subunit omitted for clarity. (C) View of the transmembrane domain from the intracellular side and shown in cartoon representation. Residues near or in the ‘GAS’ belt are shown as sticks. (D) Close-up view of the boxed region in (C) illustrating how the hydroxyl group of Ser 445 caps the TM2a helix of an adjacent subunit.

