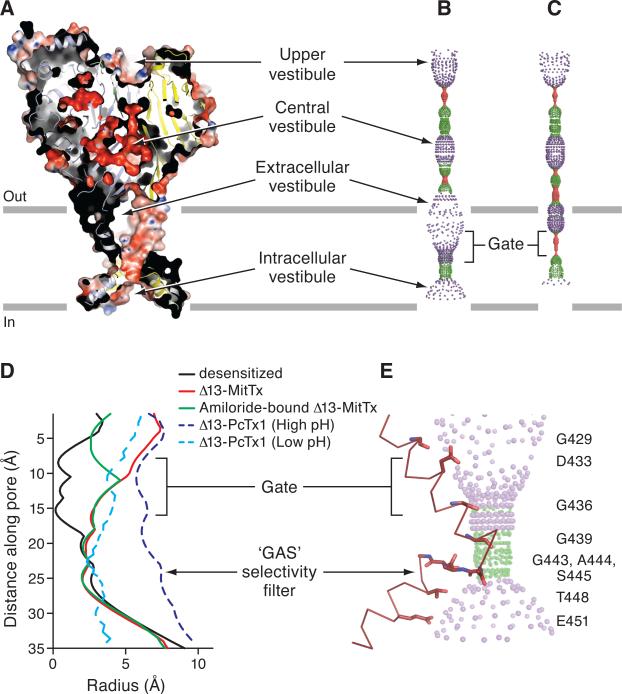
Figure 5.
The Δ13-MitTx complex harbors an open pore with a constriction located below the gate near the ‘GAS’ belt. (A) A section of an electrostatic potential of Δ13. Pore-lining surface down the threefold axis of the Δ13-MitTx (B) and the desensitized state structures (C). The plots in (B) and (C) were generated using the HOLE software (pore radius: red < 1.15 Å < green < 2.3 Å < purple). (D) Plot of radius as a function of longitudinal distance along the pore for Δ13-MitTx (red), Δ13-MitTx (amiloride, green), desensitized state (black), Δ13-PcTx1 (high pH, dark blue), and Δ13-PcTx1 (low pH, light blue). (E) Close-up view of the pore domain. Only one TM2 domain is shown for clarity and is in ribbon representation. Residues lining the pore are shown as sticks.

