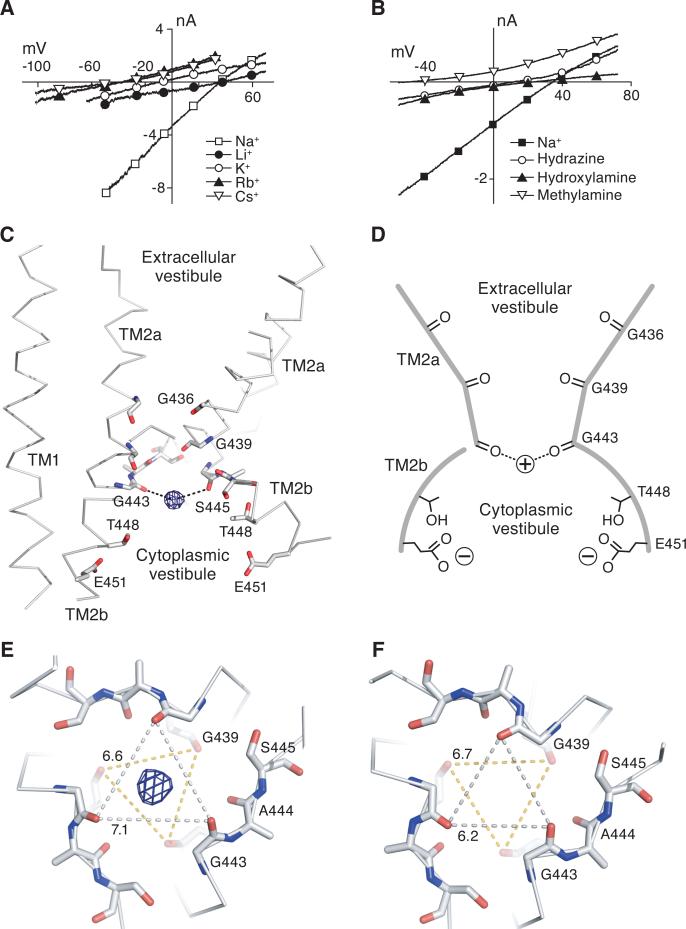
Figure 6.
Selectivity and structure of the ‘GAS’ selectivity filter. Whole cell, patch-clamp current/voltage analysis of the Δ13-MitTx complex in the presence of alkali metal cations (A) or organic cations (B). (C) Close-up view of the ‘GAS’ belt. Glycine residues 436 and 439, and residues in the ‘GAS’ belt are shown as sticks. One subunit has been omitted for clarity. A 2Fo-Fc map contoured at 1.5 σ illustrates the monovalent Cs+ site in the ‘GAS’ belt. This peak overlaps with an electron density peak calculated using anomalous difference amplitudes as coefficients. (D) Schematic illustration showing how the conductive pore is lined with carbonyl oxygens. (E) View of the ‘GAS’ belt from the intracellular side, perpendicular to the membrane plane, from the Cs+ soaked crystals, showing the 2 Fo-Fc peak for Cs+ and distances between the Gly 443 (7.1 Å) and Gly 439 (6.6 Å) carbonyl oxygen atoms. (F) Same view as in (E) of the ‘GAS’ belt derived from the Δ13-MitTx complex in the presence of Na+, showing how the size of the selectivity contracts in the presence of Na+, as measured by the distance between Gly 443 carbonyl oxygen atoms (6.2 Å). See also Table S2.

