
Fig. 4.
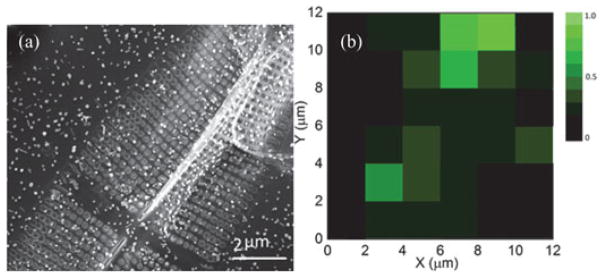
(a) SEM image of the acquisition area for SERS mapping. (b) The map of Raman signal intensity at 1368 cm−1 normalized by the NP numbers in each grid showing in the SEM image. The excitation power was set at 1.2 mW and the integration time was 1 s.