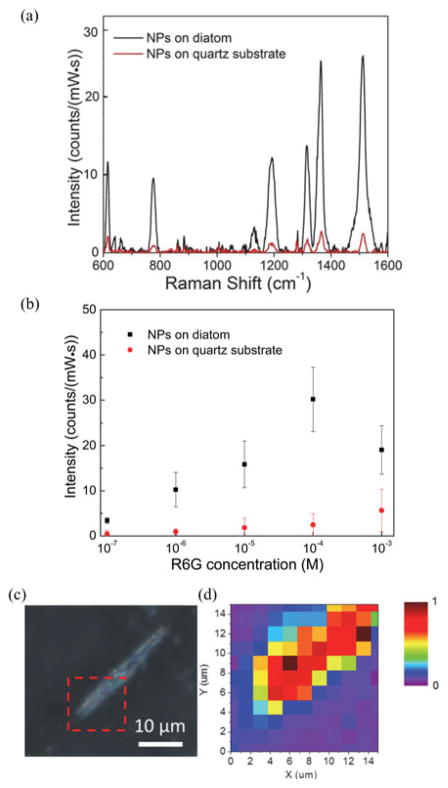
Fig. 5.
(a) SERS spectra of 100 μM R6G coated on Ag NPs-on-diatom (black) and Ag NPs-on-quartz (red), (b) Intensities of Raman band 1368 cm−1 for different R6G concentrations. (c) Optical image of the area scanned for SERS measurement, and (d) map of Raman signal intensity at 1368 cm−1. During the measurement, the integration time was 60 s and the grating groove density was set at 300/mm. The excitation power was 2.1 mW.

