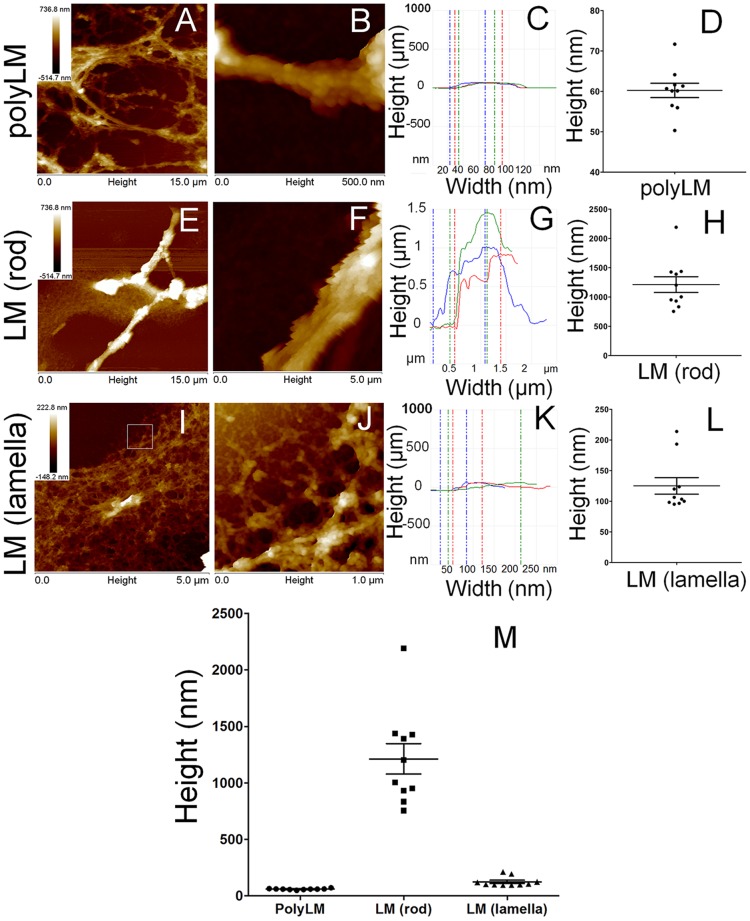
Figure 5. AFM analysis of polyLM and LM at increasing magnifications.
PolyLM (A, B) and LM (E, F, I, J) obtained as described in Figure 4 were scanned in areas of 225 µm2 (A, E, I) or 0.25 µm2 (B, F, J) and shown in height mode. In order to determine the thickness of the structural units forming each polymer, the heights of 10 struts were calculated in the fields depicted in B (struts of the polyLM mesh), F (rods in LM) and J (lamellas in LM). Considering that both matrices were multilayered, each structure selected for measurement followed the criteria of being the closest possible to the support (glass coverslip). Panels C, G and K depict examples of three measurements and panels D, H and L show the distribution of the values obtained for each 10 structures. The white square in I represents an area at the edge of the lamellar structure used for the height measurement. Panel M shows the distribution of heights obtained at each condition all together for comparison.

