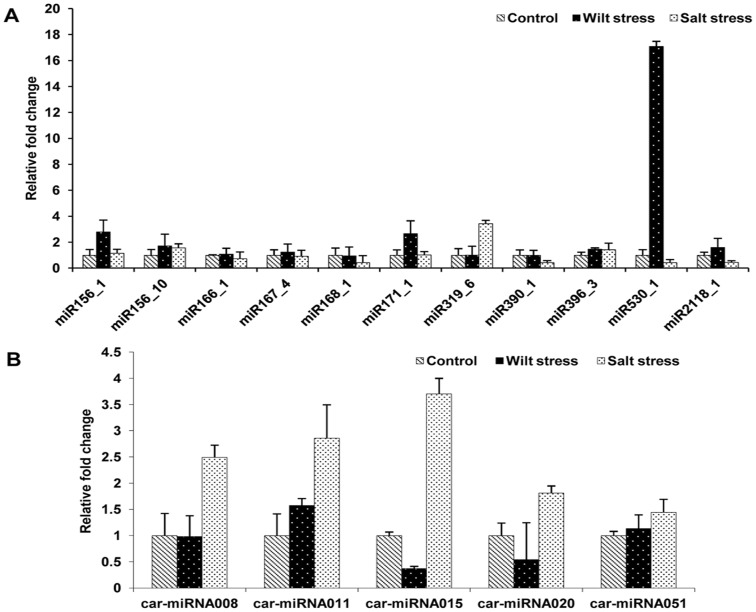
Figure 5. Expression analyses of selected miRNAs under wilt and salt stresses as evaluated by qRT-PCR.
The relative expression levels are shown as fold changes with the standard errors (SE) of three biological replicates. (A) Expression profiling of conserved miRNAs under control, wilt and salt stress conditions. (B) Expression profiling of novel miRNAs under control, wilt and salt stress conditions.

