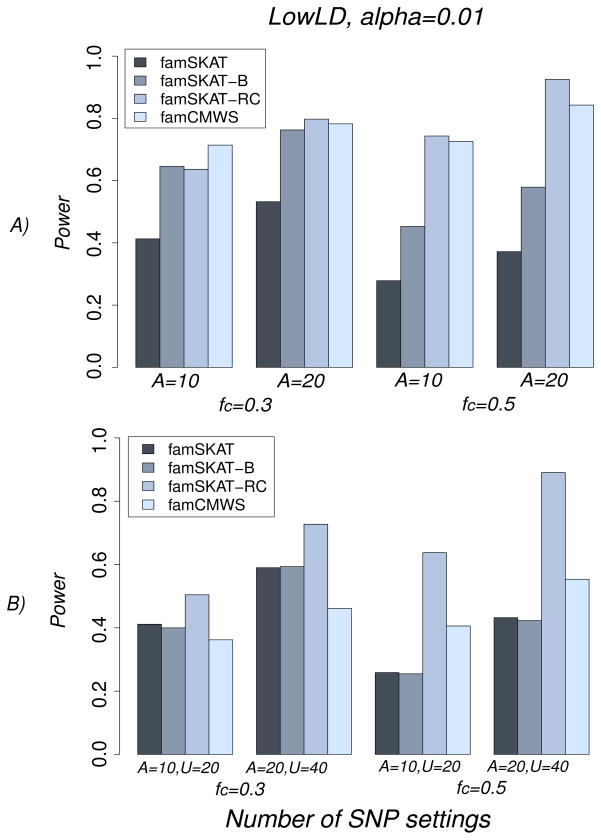
Figure 4.
Power of famSKAT, famSKAT-B, famSKAT-RC, and famCMWS in the sequence data, under the LowLD pattern, for the different settings of number of associated and non-associated SNPs and the proportion of common SNPs among them; A) For a model with associated SNPs only: A=10, fc=0.3; A=10, fc=0.5; A=20, fc=0.3; and A=20, fc=0.5; B) For a model with associated and non-associated SNPs: A=10, U=20, fc=0.3; A=10, U=20, fc=0.5; A=20, U=40, fc=0.3; and A=20, U=40, fc=0.5, where fc is the proportion of common SNPs.

