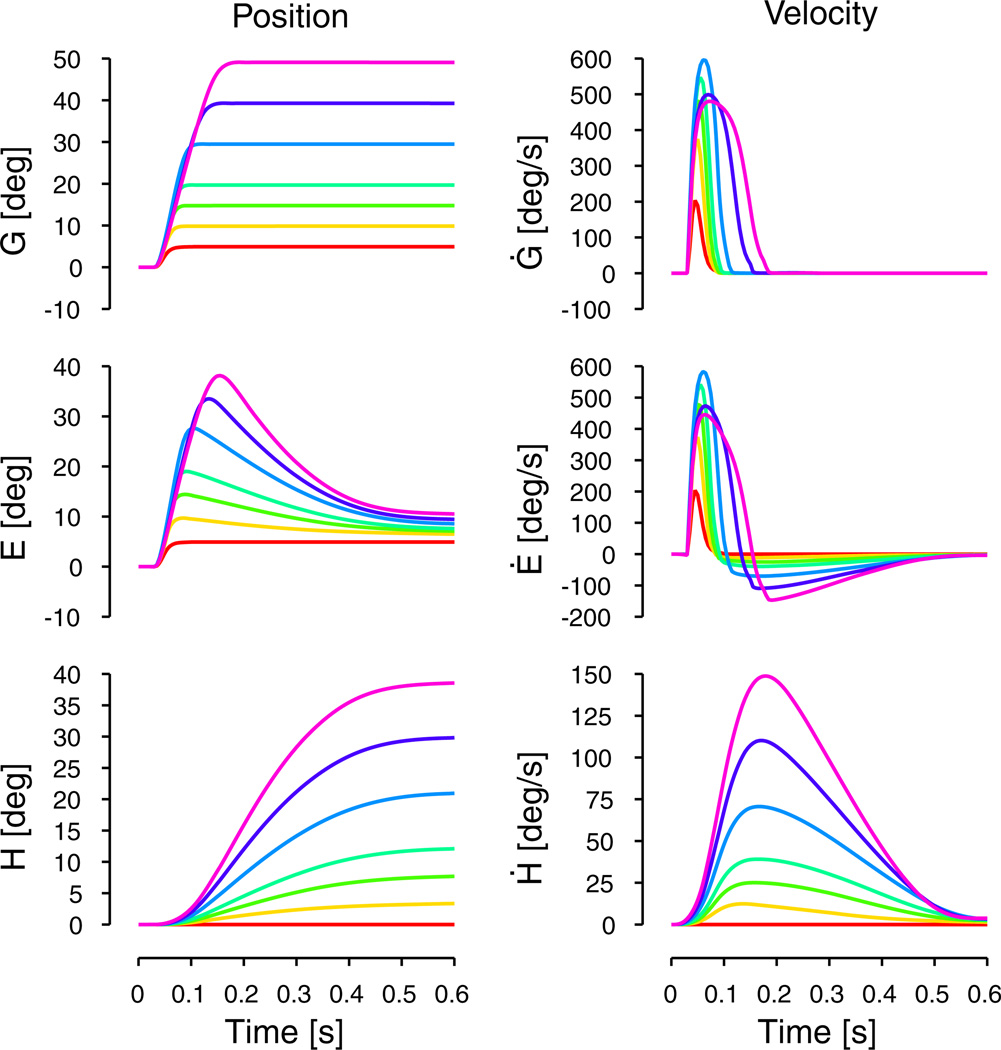
Fig. 4.
Family of simulated horizontal gaze shifts. Left column represents the time course of position and right column represents the time course of velocity for the gaze (first row), the eye-in-head (second row) and the head (third row) for different desired gaze saccade amplitudes (5, 10, 15, 20, 30, 40 and 50°). The corresponding desired head amplitude was set to (0, 4.5, 9, 14.5, 22.5, 31.5 and 41.5°). Peak eye and gaze velocity decline for large gaze shifts. Peak head velocity occurs later for large gaze shifts

