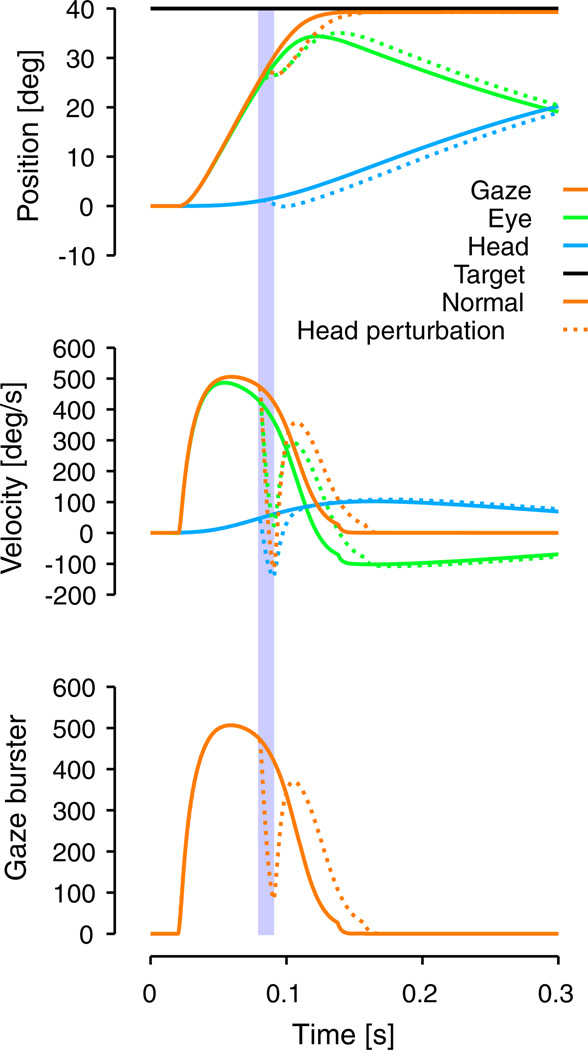
Fig. 9.
Model response to a head perturbation. Upper row represents gaze (orange lines), eye-in-head (green lines) and head (blue lines) positions as a function of time. Middle row represents the velocity time-course for the same signals. Bottom row represents the evolution of gaze burster activity as a function of time. Solid lines represent the normal conditions. Dashed lines represent a simulation with an opposing torque applied to the head for 10 ms starting 80 ms after the onset of the gaze movement. The time during which the torque was applied is represented by the colored rectangle. Gaze and head started at (0, 0)°, the desired gaze displacement was set to (40, 0)° and the desired head displacement was set to (30, 0)°. The same color conventions as in Fig. 7 apply here

