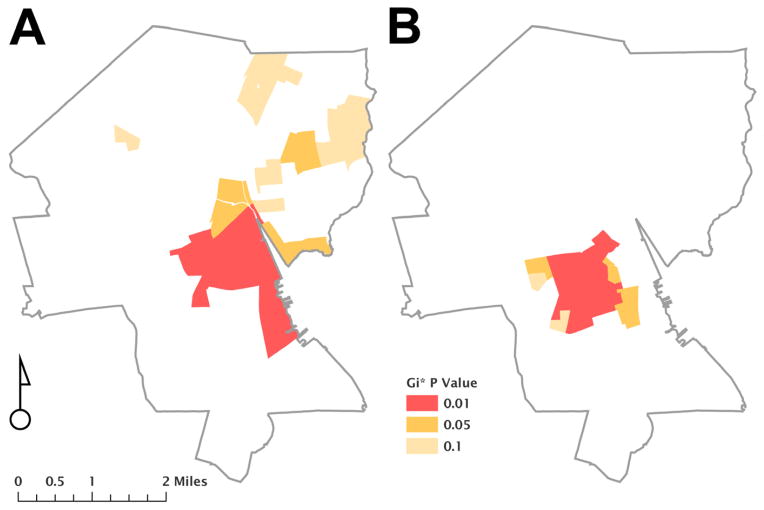
Figure 2. Geospatial representation of HIV-infected individuals living in Providence, Rhode Island.
The figure shows two maps of Providence, Rhode Island based on 2010 US Census tract block groups and representing the geographic location of individuals infected with HIV-1 subtypes B (part A) and non-B (part B). Getis-Ord Gi* analysis of geocoded addresses reveals clusters of infections, which differs among subtypes, as represented by color shading.

