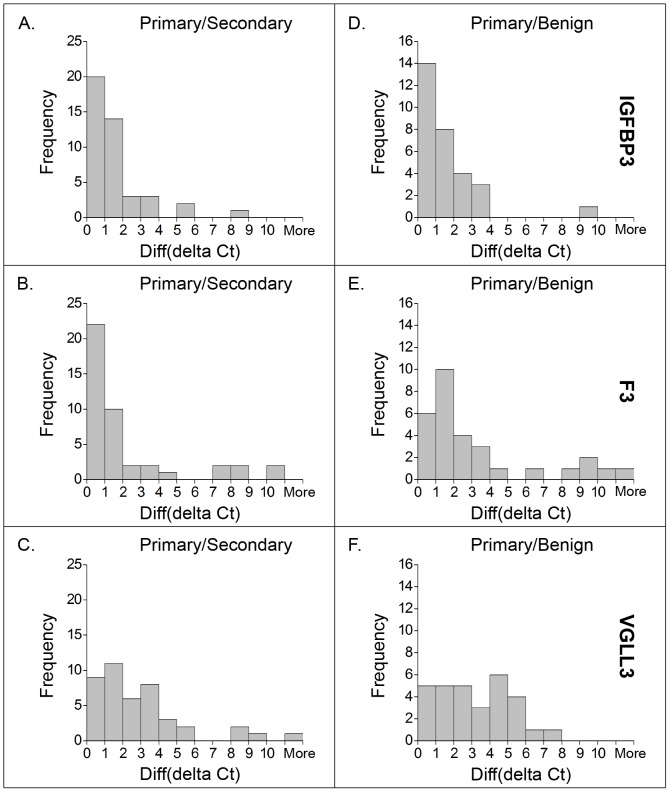
Figure 1. Comparisons of differences in gene expression levels within primary/secondary cancer samples and primary/benign samples.
The same definition of sample measurements as described in Materials and Methods section is used here. The expression levels of three genes were measured as the delta Ct values (i.e. Ct value of gene-Ct value of GAPDH). The differences in gene expression levels between different samples originating from the same patient are presented as Diff (delta Ct), = max (delta Ct value)-min (delta Ct value). We estimated the similarity of gene expression levels in tumor biopsies by comparing the three genes' Diff (delta Ct) values in primary and secondary cancer samples from 43 patients (Panels A, B and C) and presenting results in the form of frequency histograms. Among these patients, 30 patients were also measured for gene expression in their accompanying benign prostate tissue samples, and results are presented in the right panels (Panels D, E and F), as frequency histograms of Diff (delta Ct) values between the primary cancer samples and benign samples. The frequency counts for delta Ct value differences within 0–1.0 or 1.0–2.0 interval were dramatically higher than those with differences larger than 2.0 for IGFBP3 and F3 as shown in the left panels of comparison. Compared to the left panels, the Diff (delta Ct) values in the right panels showed higher frequency in the larger Diff (delta Ct) value intervals for all three genes, but particularly for VGLL3.

