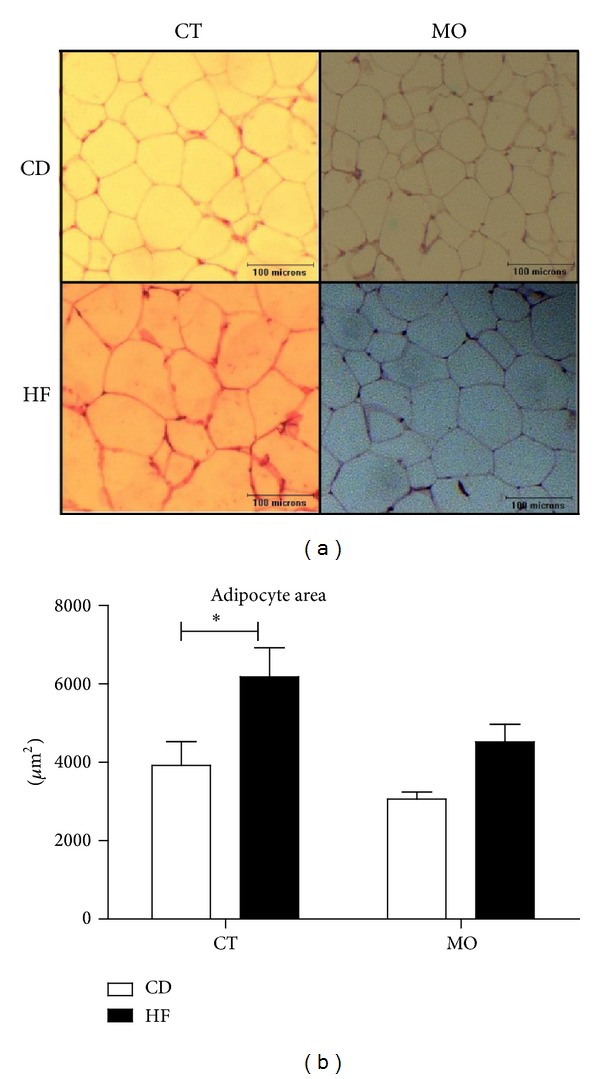
Figure 1.

Effect of MO supplementation on adipose tissue histology. (a) Histological sections stained with H&E. (b) Area of adipocytes. CD = group of animals maintained on control diet; HF = group of animals fed high-fat diet; CD + MO = group of animals fed control diet supplemented with macadamia oil; HF + MO = group of animals fed high-fat diet supplemented with macadamia oil. The data are given as the means ± S.D. *P < 0.05 (n = 6).
