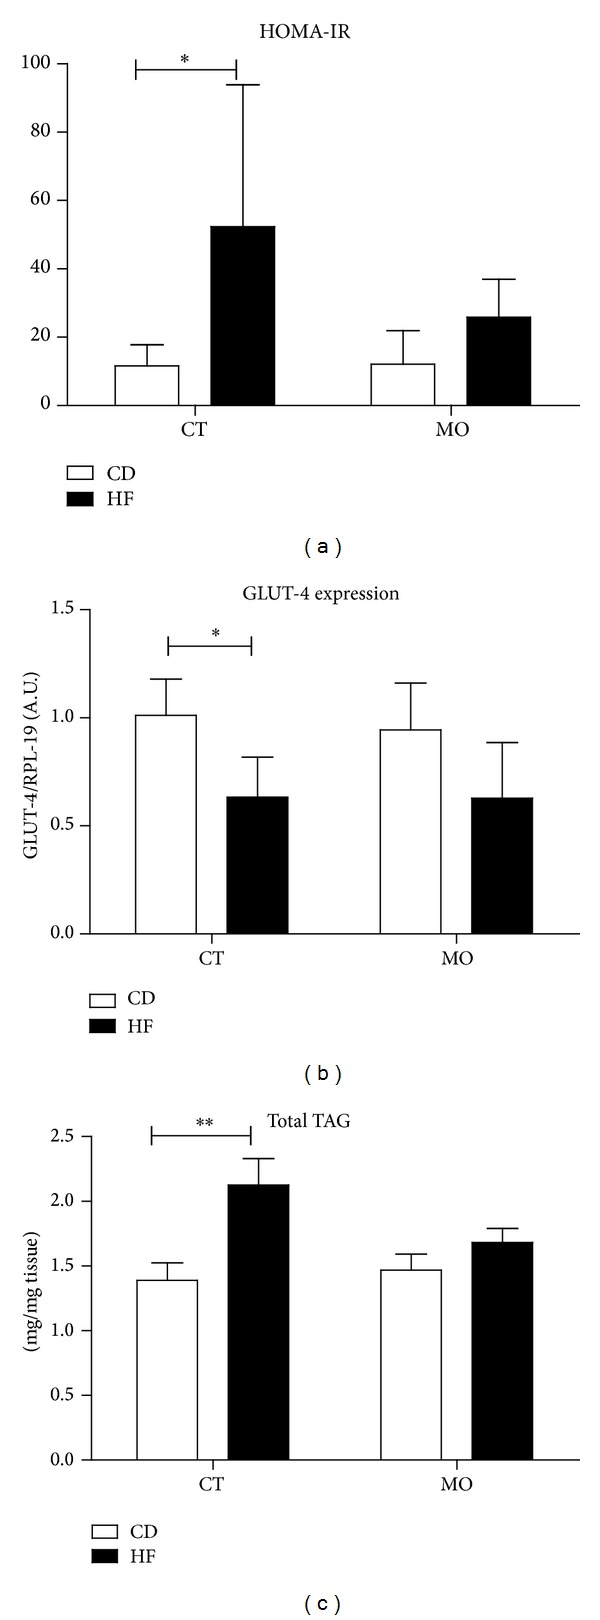
Figure 2.

Insulin sensitivity and triacylglycerol content in skeletal muscle after 12 weeks. (a) HOMA-IR: homeostatic model assessment of insulin resistance; (b) GLUT-4 gene expression; (c) triacylglycerol content in gastrocnemius muscle. The data are given as the means ± S.D. In all experiments the animals were previously fasted for 6 hours. CD = group of animals maintained on control diet; HF = group of animals fed high-fat diet; CD + MO = group of animals fed control diet supplemented with macadamia oil; HF + MO = group of animals fed high-fat diet supplemented with macadamia oil. A.U. = arbitrary unit. *P < 0.05; **P < 0.01 (n = 6).
