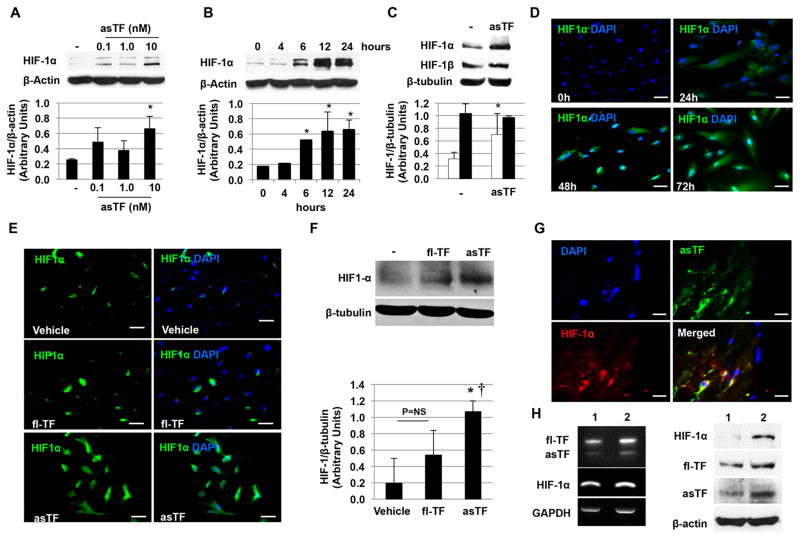
Figure 3.
asTF induces HIF-1α up-regulation. A. Western blot analysis of endothelial cell lysates shows an asTF-dose-dependent increase of HIF-1α vs. control (vehicle). B. Time course studies showed an increase in HIF-1α as early as 6 hours with a peak at 12–24h vs. control (vehicle). C. Unlike HIF-1α (white bars), no significant effect of asTF on HIF-1β (black bars) was observed. D. Immunofluorescence staining showing the time course of HIF-1α expression (Alexa Fluor 488) in endothelial cells treated with asTF (10 nM) vs. control (vehicle). DAPI was used as counterstaining. E. Up-regulation of HIF-1α was also observed in HAEC treated with asTF (10nM) for 24 hours (left). No significant effect was observed when HAEC were treated with fl-TF (right). Magnification 200x. Scale bar=50 μm. F. Similar results were confirmed by western blot analysis of cell lysates treated with either fl-TF (10nM) or asTF (10nM) for 24 hours. *P=0.02 vs. vehicle, † P=0.04 vs. fl-TF. G. Immunofluorescence staining showing co-localization of HIF-1α (Alexa Fluor 594) and asTF (Alexa Fluor 488) in complicated (type VI) carotid plaques. DAPI was used as counterstaining. Magnification 1000x. Scale bar= 10μm. H. asTF mRNA was identified by PCR in carotid plaques. Sample 1 is from type IV–V plaques (n=5), sample 2 is from type VI lesions (n=5). An increase in HIF-1α expression was observed in sample 2 also characterized by a higher asTF gene expression. Western blot analysis of the same samples confirmed the findings at the protein level. Data from in vitro experiments are the average of triplicates of single experiments that were repeated 3 times.

