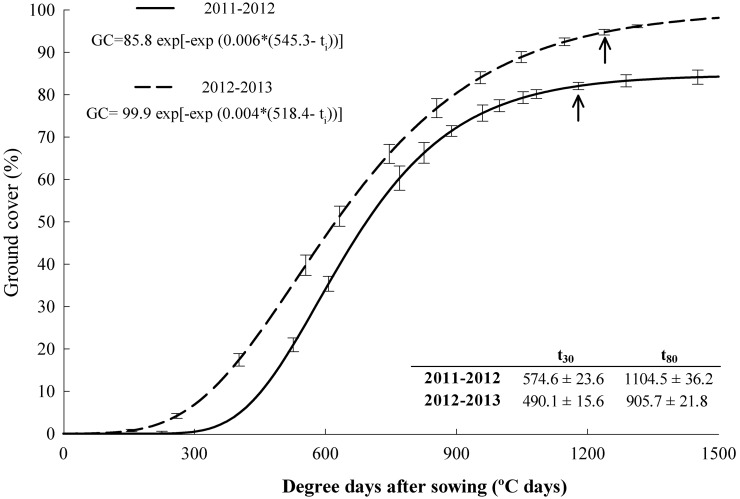
Figure 2. Ground cover (GC) development during the cover crop growth period in both experimental seasons.
Arrows show the first kill date. Lines represent the Gompertz model adjusted to the observed values. Fitted models and the thermal time until the ground cover reaches 30 and 80% (t30 and t80) are shown.

