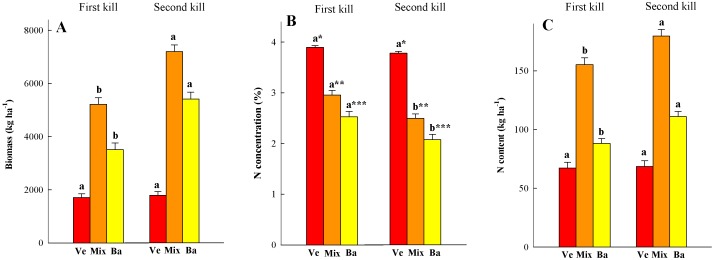
Figure 3. Biomass (A), N concentration (B) and N content (C) for vetch (Ve), barley (Ba) and the mixture (Mix) measured for the first and second kill dates.
Values are the mean of two cropping seasons. Letters above bars show significant differences between kill dates for each species, and asterisks between species for each kill date. Small bars represent the standard error.

