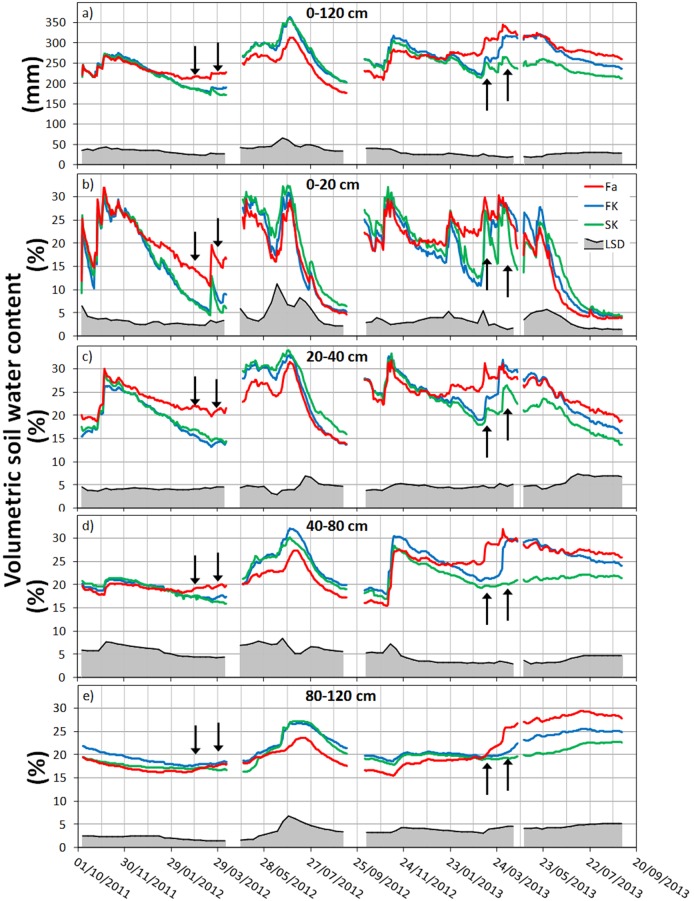
Figure 7. Soil water content monitored with the capacitance sensors at different depths for the fallow (Fa), first kill (FK) and second kill (SK) treatments during the experimental period.
Arrows represent the first and second kill dates. The shadowed area in the bottom represents the LSD at 0.05 probability level.

