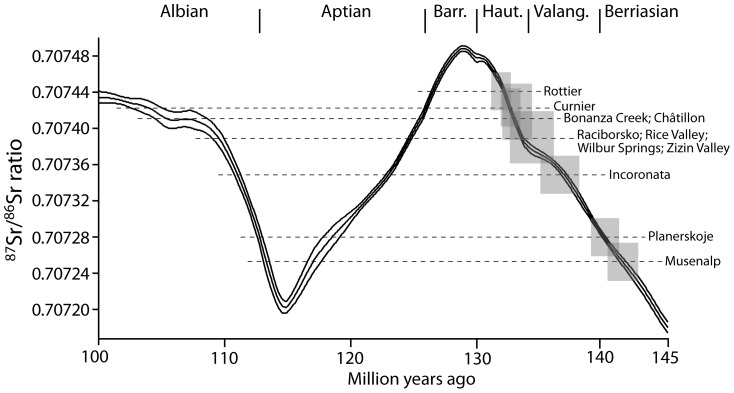
Figure 4. Strontium isotope curve for the Early Cretaceous and its upper and lower confidence interval [52].
Dashed lines indicate our measurements on Peregrinella shells; shaded areas indicate the error margins (vertical: Sr isotope ratio; horizontal: geologic age) of those ages that fall within the biostratigraphically possible age range.

