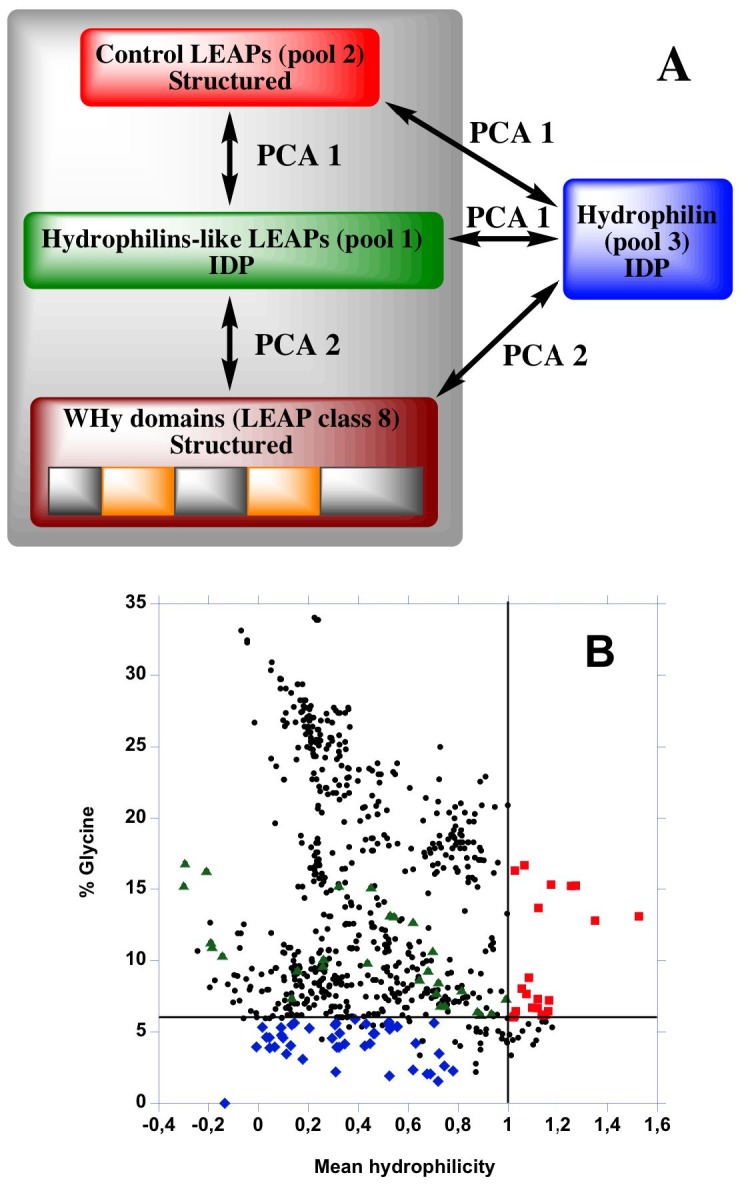
Figure 1. Schematic representation of the approach for the study of LEAPs, hydrophilins and [WHy domain/LEAP class 8].

(A) PCA 1: principal component analysis of the three pools. PCA 2: principal component analysis of [WHy domain/LEAP class 8] vs. [hydrophilins/LEAP class 2]. IDP: intrinsically disordered proteins. (B) Distribution of hydrophilins-like LEAPs, control LEAPs, hydrophylins and other LEAPs. Red squares: pool 1 (hydrophilins-like LEAPs) retrieved from LEAPdb characterized by %Gly>6%, GRAVY<−1 and mean hydrophilicity>1. Blue rectangles: pool 2 (control LEAPs) retrieved from LEAPdb characterized by %Gly<6%, GRAVY>−1 and mean hydrophilicity<1. Green triangles: pool 3 (hydrophilins) characterized by 6,2<%Gly<16,8%, −1,86<GRAVY<−1, −0,3<mean hydrophilicity<1. Black circles: all other LEAPs.
