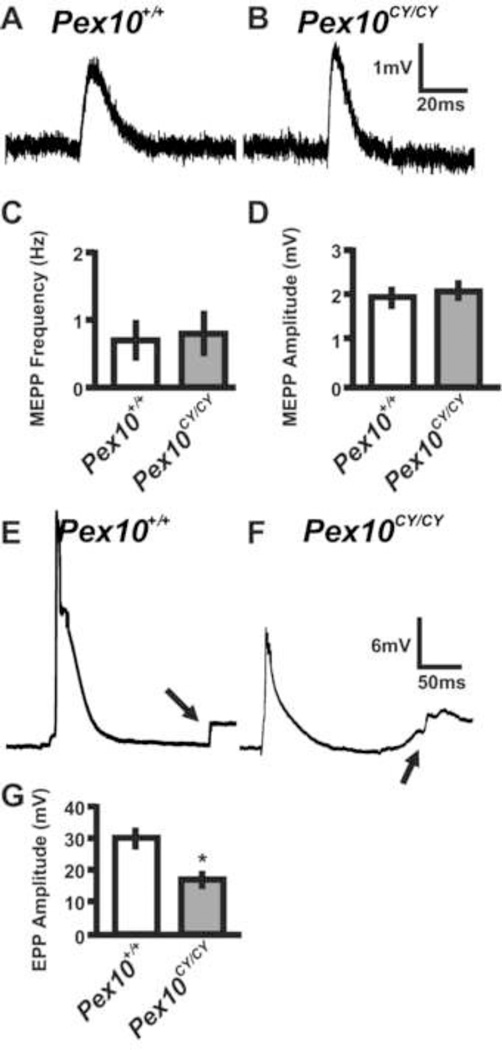
Figure 6. Pex10CY/CY diaphragm muscle displays decreased evoked transmitter release.
Sharp electrode recordings of E18.5 wildtype and Pex10CY/CY diaphragms in Ringer’s solution. A, B. Representative spontaneous EPP (MEPP) from E18.5 wildtype and Pex10CY/CY diaphragms. C, D. Quantification of MEPP frequency and amplitude. E, F. Representative evoked EPP from E18.5 wildtype and Pex10CY/CY diaphragms (Note; arrows highlight the muscle contraction after the EPP). G. Quantification of EPP amplitude. Scale bars adjacent to traces in B and F. Asterisk in G indicates a significant difference (p= 0.001; t-test).

