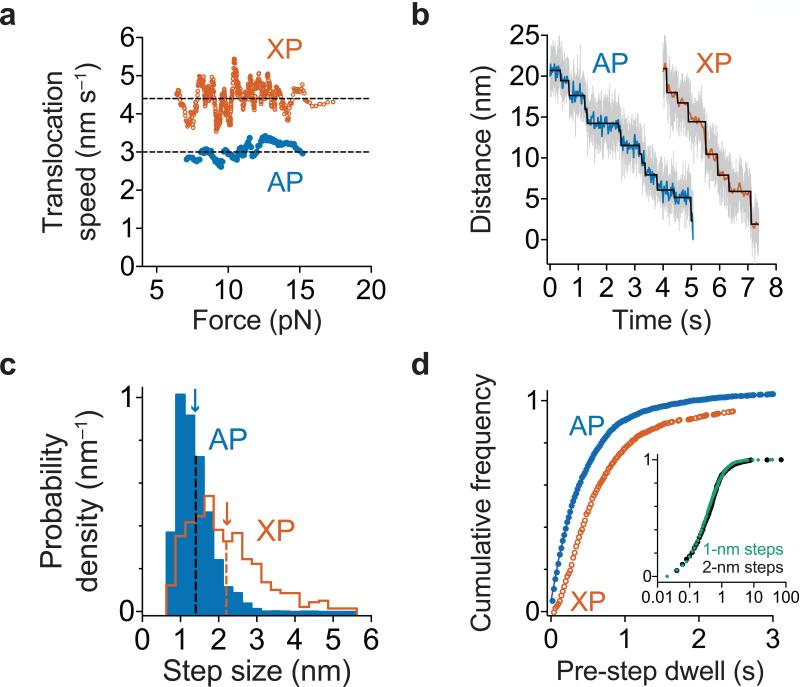
Figure 3.
Polypeptide translocation. (a) Translocation speeds for ClpAP and ClpXP. Moving-window averages of 30 consecutive titin values from combined V13P and V15P domains ranked by increasing force are shown. ClpXP titin data are from ref. 17. (b) Representative traces of polypeptide translocation on unfolded titin for ClpAP (n = 127 domain translocation events) and ClpXP (from ref. 17) at ~13 pN. Raw data were decimated to 1 kHz (gray) or 50 Hz (blue for ClpAP and orange for ClpXP). Chi-square fits37 to the 50 Hz data are shown in black. (c) Blue bars show the distribution of ClpAP physical step sizes during translocation of titin and GFP domains (n = 2642 steps) with a mean of 1.4 ± 0.5 nm (blue arrow). The ClpXP step-size distribution (previously published in ref. 17) is shown in orange for comparison. (d) Distributions of dwell times preceding a step during titin and GFP translocation are shown for ClpAP (blue; n = 2585 dwell times) and ClpXP (orange; data from ref. 17). For ClpAP, the solid line is a fit to a sum of exponentials. Inset: Dwells preceding ClpAP steps of 1 and 2 nm in size are shown.

