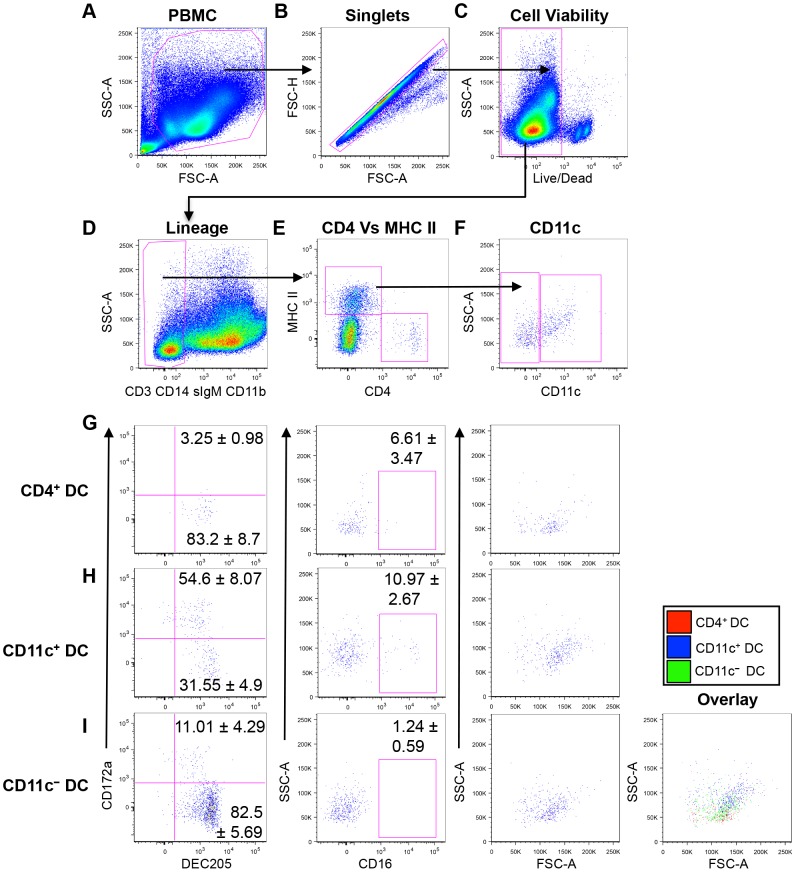
Figure 1. Phenotypic characterization of peripheral blood DC subsets.
7-color flow cytometric analysis of bovine PBMC to identify DC. Doublets (B) and dead cells (C) were excluded from the total PBMC population. Using lineage specific antibodies (anti-CD3, anti-CD14, anti-IgM, and anti-CD11b), T cells, monocytes, B cells and NK cells were excluded (D). Lineage negative cells were then gated to identify MHC class II+ and CD4+ cells (E), and the MHC class II+ cells were assessed for CD11c expression (F). Surface expression of DEC205, CD172a, and CD16 by CD4+ DC (G), CD11c+ DC (H), and CD11c− DC (I). Size (FSC) and complexity (SSC) of DC subsets was also assessed by back-gating on the cell of interest. Data are representative of four independent experiments in six different animals. Numbers on plots represent average percentage of cells expressing the surface molecules in six cattle, and error bars represent standard error.

