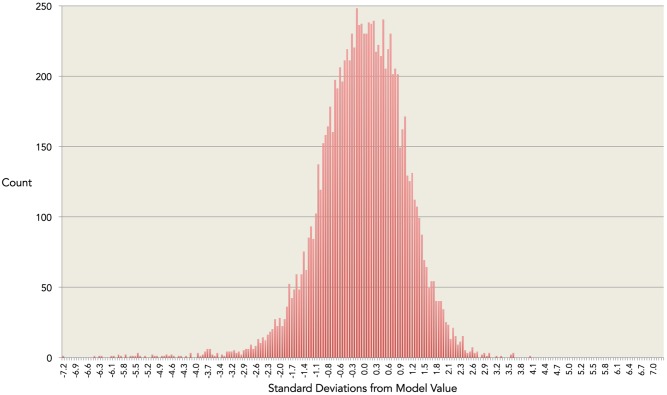
Figure 2. Residual analysis.
The residuals are the variations in log-adjusted observed values from the log-adjusted age-related mean value predicted by the model. The residuals have excellent goodness of fit to an ideal Gaussian curve (r2 = 0.99). 71% of the residuals are within one standard deviations (SD) of the mean, 95% within 2 SD, and 99% within 3SD. The percentages for an ideal Gaussian distribution are 68%, 95% and 99% respectively.

