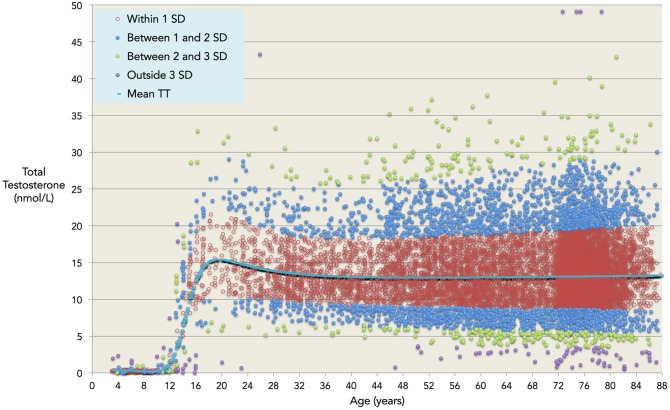
Figure 4. The validated model.
Our dataset (n = 10,098) of observed total testosterone for ages 3–88 years, split into normative ranges determined by mean predicted values (blue line) and one (red), two (blue), three (green), and four (purple) standard deviations higher and lower than the predicted values.

