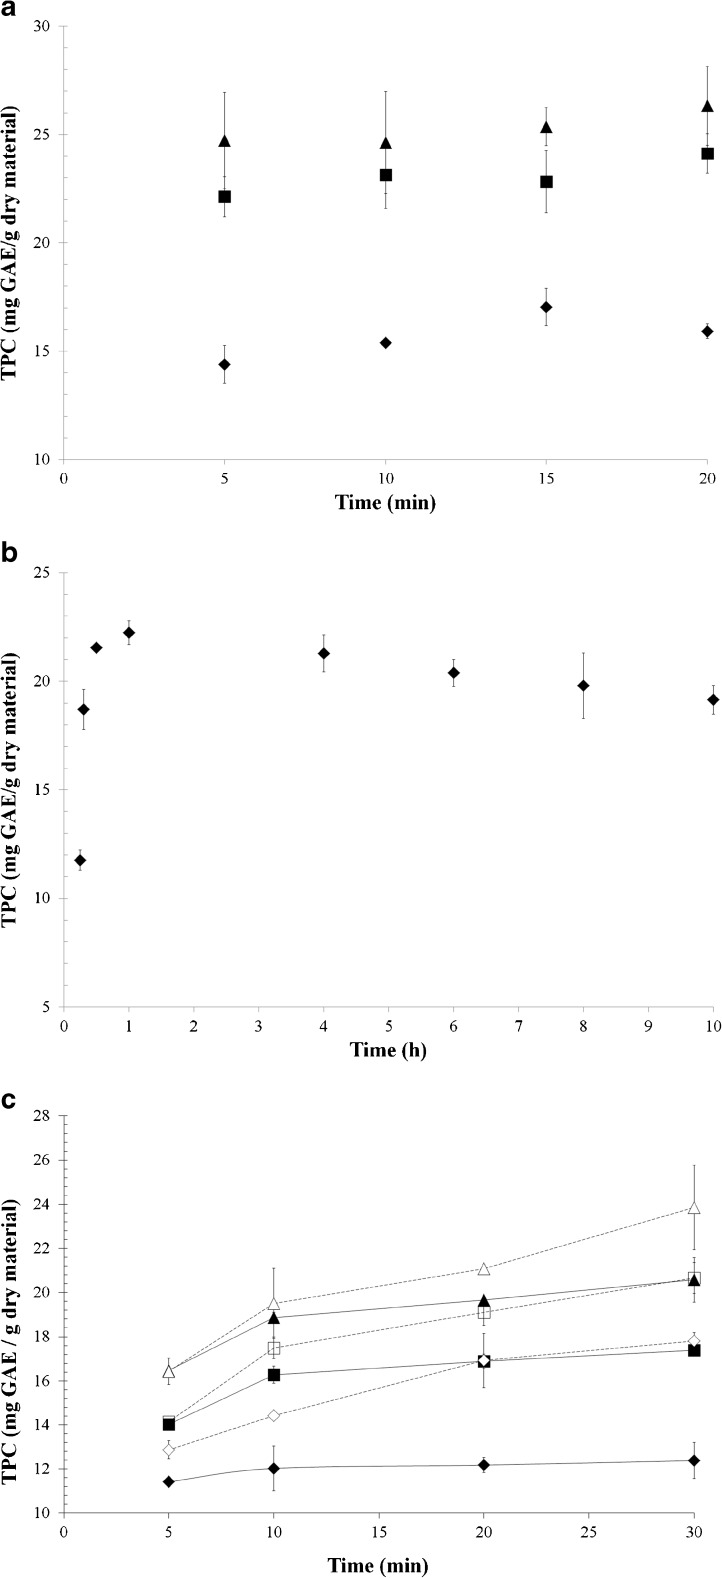
Fig. 1.
Total phenolic contents (TPC) of nettle extract obtained a by microwave-assisted extraction at different solid to solvent ratios (♦) 1:10, (■) 1:20, (▲) 1:30, for different extraction times, b conventionally at 1:30 solid to solvent ratio for different extraction times, and c by ultrasound-assisted extractions at different conditions (♦) 50 % power and 1:10 solid to solvent ratio, (■) 50 % power and 1:20 solid to solvent ratio, (▲) 50 % power and 1:30 solid to solvent ratio, (◊) 80 % power and 1:10 solid to solvent ratio, (□) 80 % power and 1:20 solid to solvent ratio, (Δ) 80 % power and 1:30 solid to solvent ratio (n = 2)

