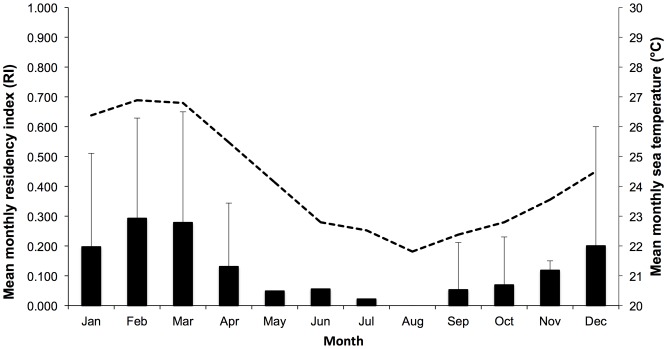
Figure 5. Mean monthly residency indices and mean monthly sea temperature.
Bar charts represent the mean monthly residency indices from all tagged bull sharks detected at the Pinnacle reef. Error bars representing standard deviation. The dashed line represents the mean monthly sea temperatures (°C) recorded at the study site.

