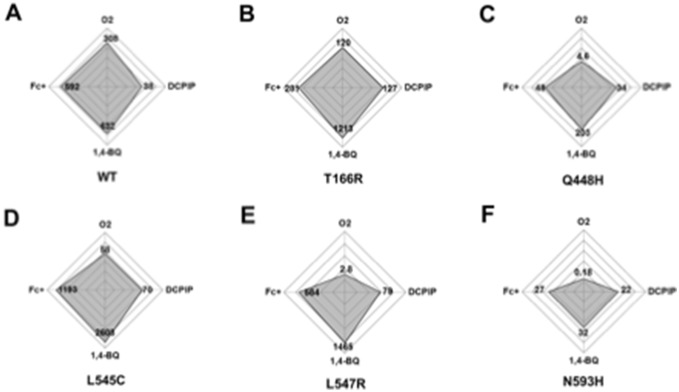
Figure 4. Radar plots illustrating the catalytic efficiency of oxidase and dehydrogenase activity.

(oxygen consumption) (DCPIP, 1,4-BQ and Fc+ as electron acceptors) of (A) wild-type POx, as well as variants (B) T166R, (C) Q448H, (D) L545C, (E) L547R and (F) N593C. The axes denote k cat/K m values in logarithmic scale from 0.01 to 10000 mM−1 s−1. Plots were prepared using Excel 2010 (Microsoft).
