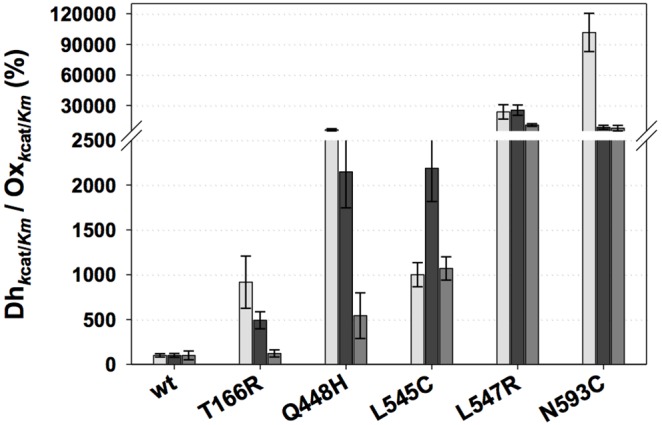
Figure 5. Dehydrogenase/Oxidase ratios of k cat/K m of POx variants compared to the wild-type.

Dehydrogenase activity was determined using DCPIP (light grey bars), 1,4-BQ (dark grey bars) and Fc+ (mid grey bars) as electron acceptors, oxidase activity was determined by following oxygen consumption. Wild-type activities were set at 100%. D-glucose was used as electron donor at 100 mM. Results are the mean of at least duplicate independent experiments and error bars correspond to standard deviations. The diagram was prepared using SigmaPlot 11.
