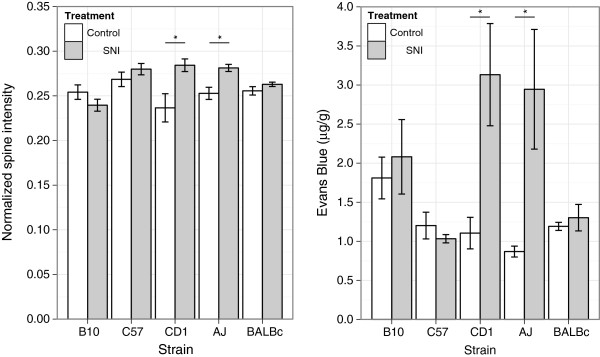
Figure 3.

Strain-related differences in BSCB permeability. Left panel shows normalized spine signal intensity in SNI (grey bars) and control (white bars) treatment groups at approximately 12 hours after surgery (n = 4–6 per group, except for CD-1: n = 2–3 per group). Right panel shows accumulation of Evans Blue dye in a separate cohort of SNI (grey bars) and control (white bars) treatment groups 24 hours after surgery (n = 5 per group). The mouse strains are ordered from least to most mechanical hypersensitivity after PNI. Data are presented as mean ± SEM; *p < 0.05 compared to controls.
