
Figure 2. Loss of HIV-1 envelope protein correlates with loss of infectivity in cell-free particles produced by cells cultured under shaking conditions.
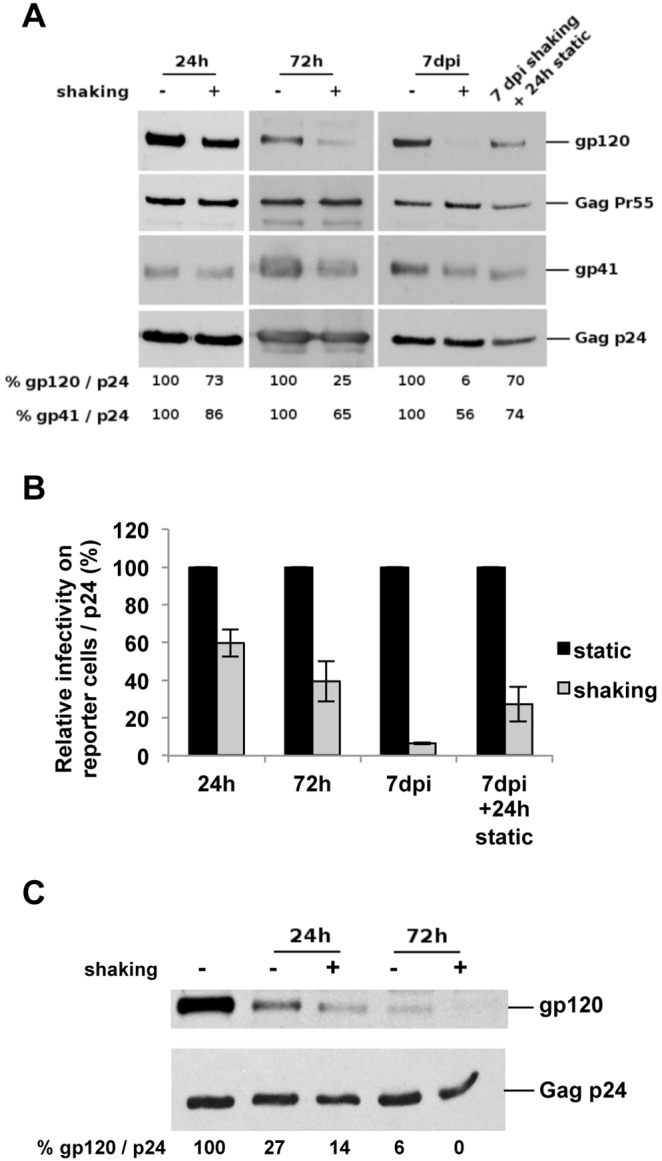
A. Quantification of viral proteins from particles recovered in supernatants of static and shaking HIV-1-infected T-cell cultures. Purified viruses from supernatants of HIV-1-infected cells were recovered and concentrated by ultracentrifugation after 24 h, 72 h and 7 days of culture, as well as after 7 days under shaking conditions followed by an additional static culture of 24 h. These purified viruses were then analyzed using antibodies against the HIV-1 Gag and envelope proteins. The envelope levels, indicated under the western blot, were estimated from the intensity of the signals on western blots using the ImageJ software and calculated as gp120/p24 and as gp41/p24 ratios. Results of one representative experiment out of four independent performed are shown. B. Infectivity of HIV-1 particles produced by static and shaking T-cell cultures. Aliquots of viral supernatants analyzed in A were used to infect indicator HeLa P4.2 reporter cells with equal amounts of virus determined by p24 quantification. The infectivity of these viruses was determined as described in Figure 1C. The data are means of two independent experiments carried out in triplicate. The values were normalized taking as 100% the average value obtained for the static culture at each time point. Statistical analysis were performed on raw data. P = 0.015 for 24 h. P = 0.002 for 72 h. P = 0.002 for 7 dpi. P = 0.002 for 7 dpi+24 h static culture. Error bars represent SEM. C. Quantification of viral proteins from particles incubated without cells under static and shaking culture conditions. Equal amounts of purified viruses from supernatants of HIV-1-infected cells were incubated at 37°C during 24 h or 72 h. Analysis and quantification were performed as in A. The envelope levels were estimated from the intensity of the signals on western blots using the ImageJ software and calculated as gp120/p24 ratios.