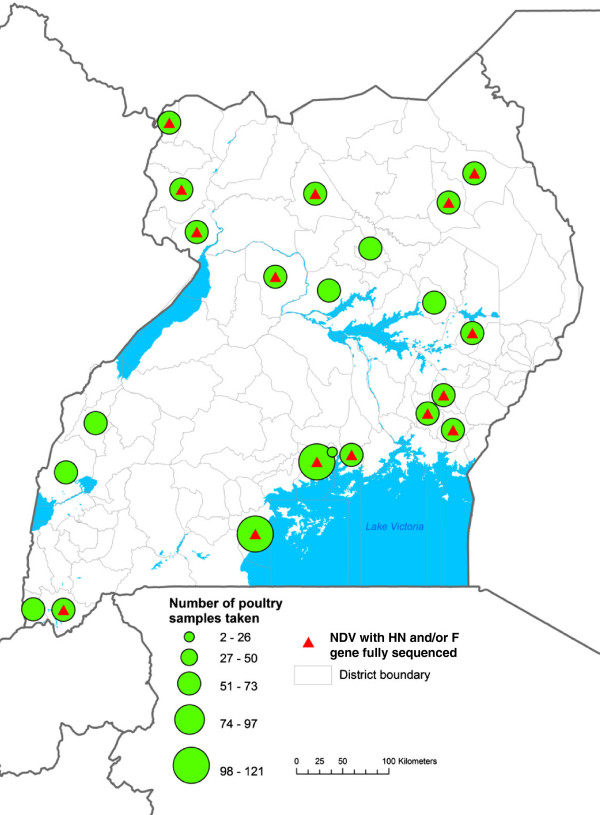
Figure 1.

Areas in Uganda (East Africa) where samples were collected. The map shows the distribution of representative isolates that were sequenced throughout the country. The green spheres show area of origin and number of samples while the red triangles show where sequence data originated.
