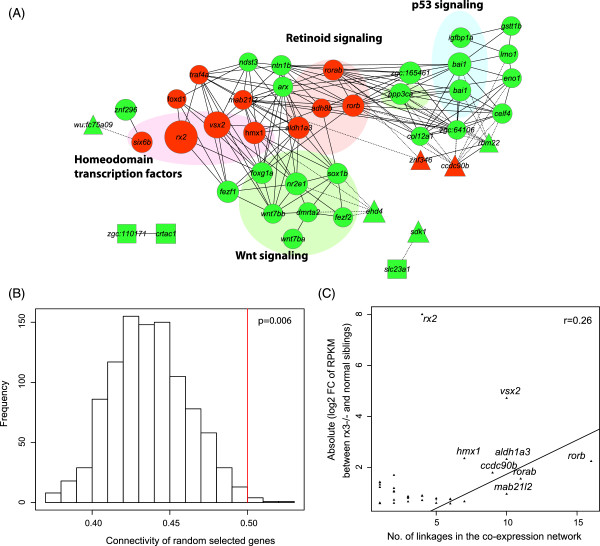
Figure 4.

A gene co-expression network of rx3 -/- regulated genes. (A) In red and green, are the gene nodes down-regulated or up-regulated, respectively, between rx3 -/- mutants and siblings. Group 1, 2 and 3 genes from the hierarchical clustering analysis in Figure 5 are represented by colored circles, rectangles or triangles, respectively. Edges connecting different nodes indicate co-expression (correlation coefficient r ≥ 0.95 or ≤ -0.95) between genes, with solid lines for positive correlations and dashed lines for negative correlations. (B) Distribution of the connectivity scores from the permutation depicted as a bar plot. The connectivity score was calculated as the average absolute correlation coefficient of any gene pairs in the selected genes. The permutation test was performed 1000 times on randomly selected genes. The red line is the connectivity score of rx3 -/-regulated genes. (C) A dot plot showing that the fold change in expression of deregulated genes between rx3 -/- mutants and siblings positively correlates with the number of gene linkages on the co-expression network. A fitted linear model of fold changes to the number of linkages was plotted. Genes with a higher number of connections in the co-expression network have higher fold changes in rx3 -/- mutants.
