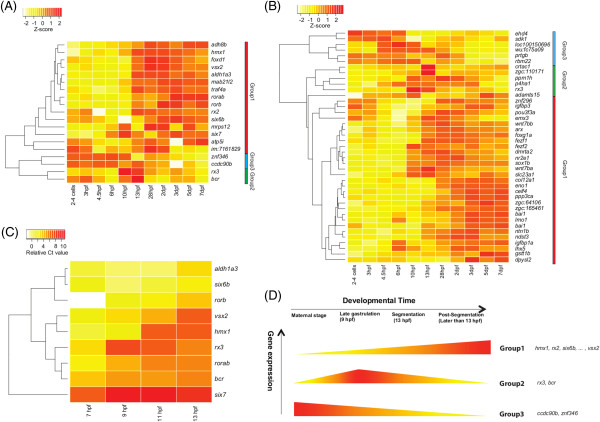
Figure 5.

Synchronous temporal expression profiles of Rx3-regulated genes. (A-C) Heatmaps depicting the temporal expression profile of Rx3-regulated genes clustered hierarchically. Hierarchical clustering based on the z-scores of relative RPKM values for rx3 -/- down-regulated (A) and up-regulated (B) genes. Genes were classified into 3 groups showing different synchronous temporal expression profiles. (C) Hierarchical clustering based on real-time PCR data. (D) Schematic view of progressive expressions of Rx3-regulated genes during early eye development. rx3 has a peak of expression at 9 hpf, and most of the Rx3-regulated genes show a transition of expression after that. Most of the genes exhibit increased expression after the onset of rx3 (Group 1). A few genes exhibit decreased expression after the onset of rx3 (Group 3).
