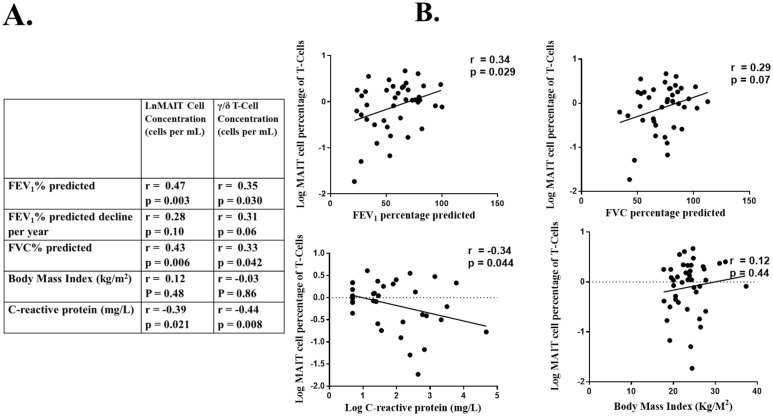
Figure 2. Relationship between MAIT and γ/δ T-cell counts and percentages with lung function.
A. Pearson’s Correlation co-efficient (r) and significance value (p) of MAIT and γ/δ T-cells and B. Correlation plots for MAIT Cell expressed as percentage of T-cell population, with FEV1 and FVC % predicted, C-reactive protein and body mass index. MAIT: Mucosal invariant T-Lymphocytes, γ/δ T-Cell: Gamma-Delta T-lymphocytes, FEV1: Forced expiratory volume in one second, FVC: Forced vital capacity.

