Figure 2.

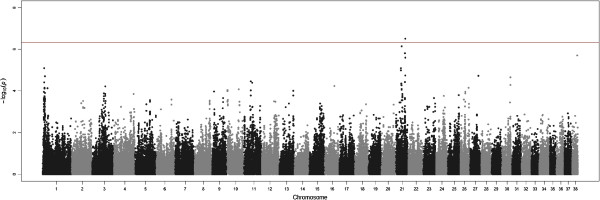
GWAS analysis for the Norberg Angle right. The genome-wide threshold (red line) corresponds to the Bonferroni correction for a nominal P-value = 0.05.

GWAS analysis for the Norberg Angle right. The genome-wide threshold (red line) corresponds to the Bonferroni correction for a nominal P-value = 0.05.