
Figure 7.
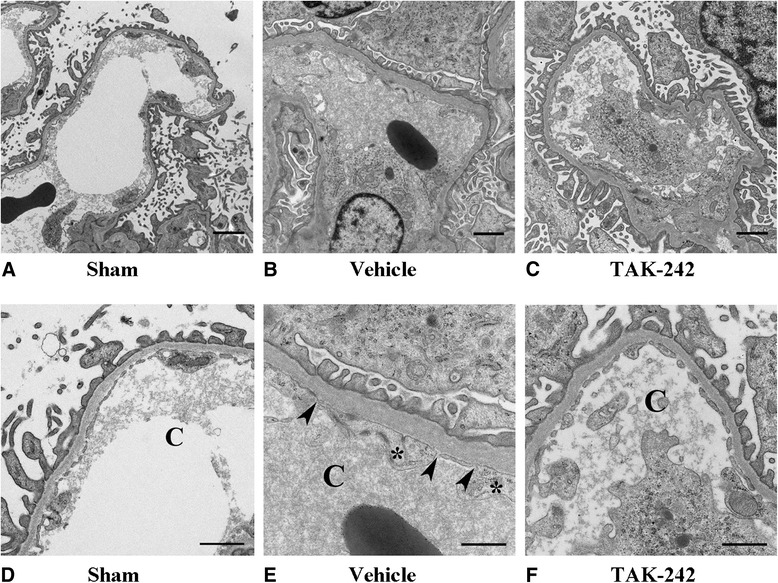
Electron microscopic images of the glomerular capillaries in sham (A), vehicle-treated (B), and TAK-242-treated (C) animals. The same images magnified showing glomerular capillaries in sham (D), vehicle-treated (E), and TAK-242-treated (F) animals. Asterisk indicates endothelial cell swelling, and arrowheads show decreased fenestration of the glomerular endothelium. Bars = 2 μm (A, B, C) and 1 μm (D, E, F).