
Figure 5.
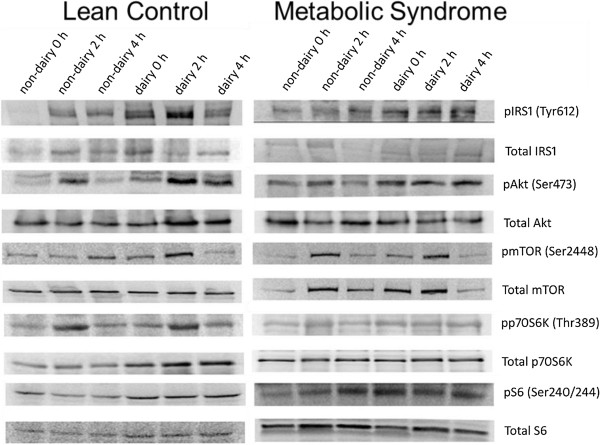
Representative Western blots. Example blots of protein extracted from samples of healthy control (left) and metabolic syndrome (right) subjects taken at baseline (0), 2 h, and 4 h post-ingestion of a mixed soy or dairy meal. Blots are shown for total insulin receptor (IRS1) and phosphorylation at Tyr616, total Akt and phosphorylation at Ser473, total mTOR and phosphorylation at Ser2448, total p70S6K and phosphorylation at Thr380 and total S6 and phosphorylation at Ser240/244.