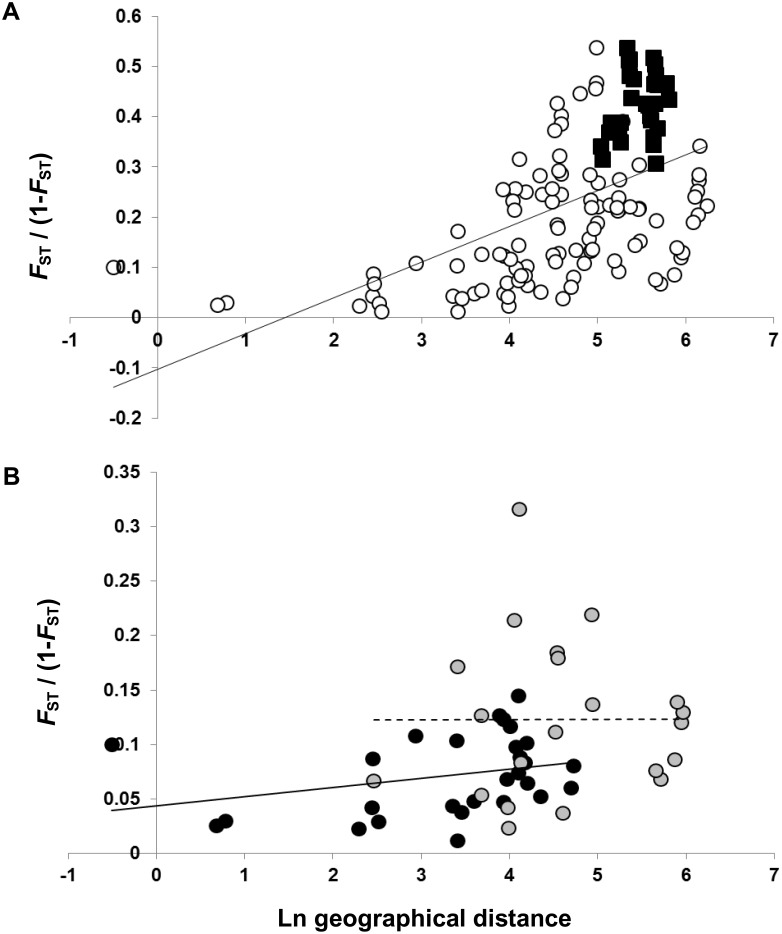
Figure 3. Isolation by distance analyses.
Correlation between log-transformed pairwise geographical distances and linearized F ST values [28] among populations of D. humilis. A. D. humilis s.l. where open circles represent pairwise comparisons among populations of D. humilis. subsp. humilis and black squares represent pairwise comparisons among populations of D. humilis. subsp. humilis and D. humilis subsp. polyanthes. Correlation between matrices was r = 53.74%, p = 0.001 for D. humilis s.l. and r = 41.61%, p = 0.004 for D. humilis subsp. humilis B. IBD analyses within geographical groups of D. humilis susbp. humilis, where black circles represent pairwise comparisons among populations of the northern group (Dhh01-Dhh08) and grey circles represent pairwise comparisons among populations of the southern group (Dhh09-Dhh15). Correlation between matrices was r = 29.62%, p = 0.080 and r = 0.47%, p = 0.420 for the northern and southern groups, respectively.

