
Figure 5.
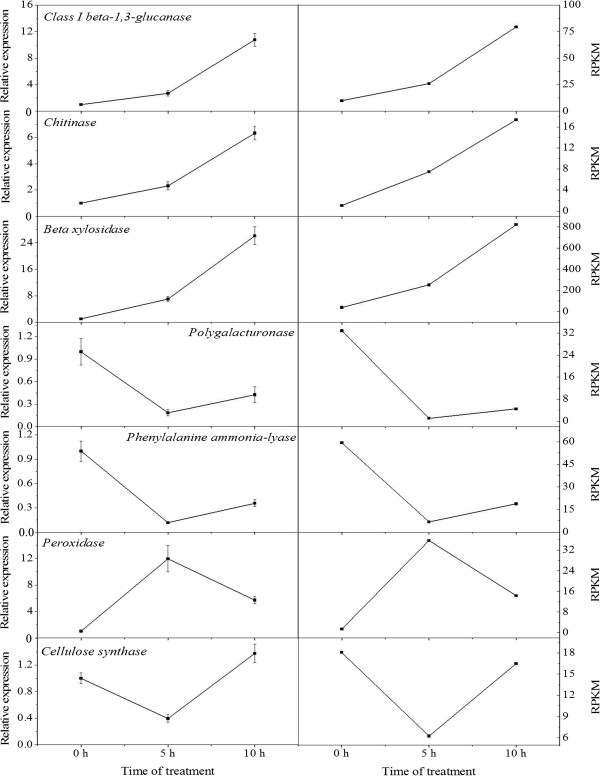
Candidate unigene expression levels revealed by qRT-PCR (left side) and RNA-seq (right side). Data from qRT-PCR are means of three replicates and bars represent SE. RPKM from RNA-seq are means of two replicates.
Official websites use .gov
A
.gov website belongs to an official
government organization in the United States.
Secure .gov websites use HTTPS
A lock (
) or https:// means you've safely
connected to the .gov website. Share sensitive
information only on official, secure websites.
Candidate unigene expression levels revealed by qRT-PCR (left side) and RNA-seq (right side). Data from qRT-PCR are means of three replicates and bars represent SE. RPKM from RNA-seq are means of two replicates.