Figure 7.

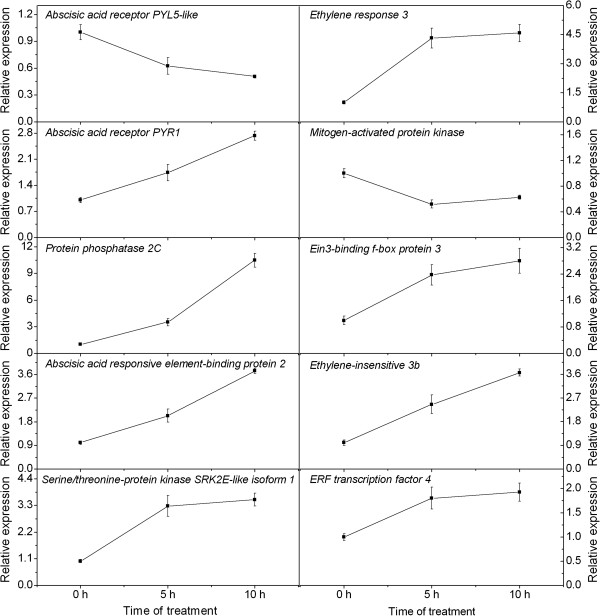
Expression levels of the candidate unigene encoding the ABA (left side) and ethylene (right side) signal transduction components revealed by qRT-PCR. Data from qRT-PCR are means of three replicates and bars represent SE.

Expression levels of the candidate unigene encoding the ABA (left side) and ethylene (right side) signal transduction components revealed by qRT-PCR. Data from qRT-PCR are means of three replicates and bars represent SE.